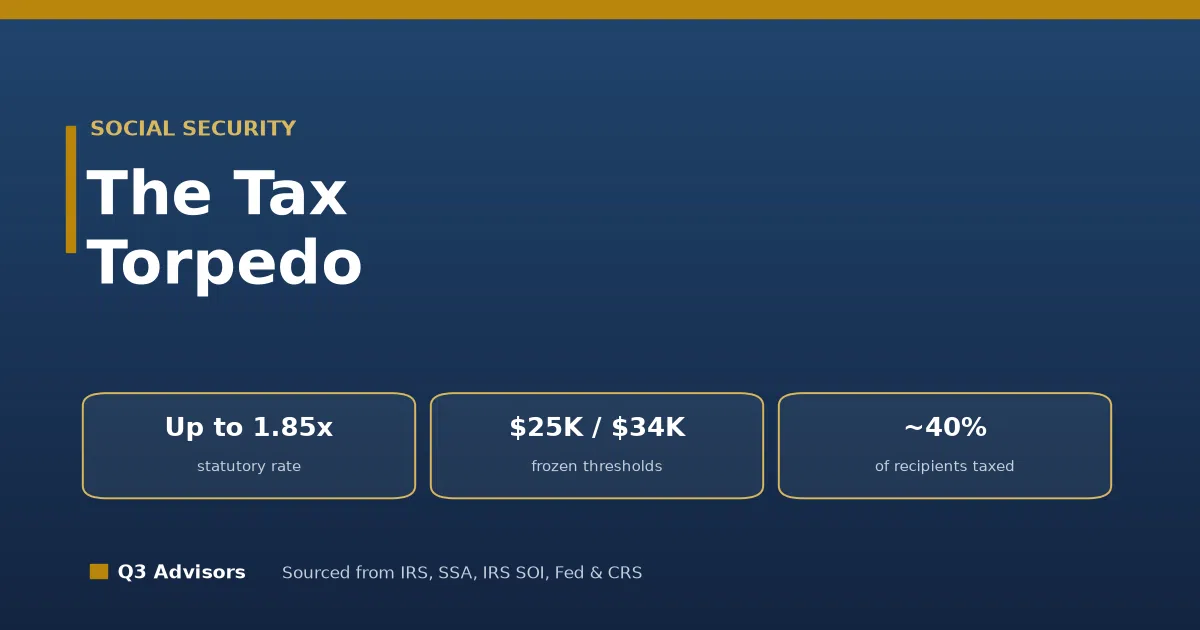
A single extra dollar of ordinary income can be taxed far more heavily in retirement than the same dollar is taxed for a worker, because that dollar can also pull an additional 50 cents or 85 cents of a Social Security benefit into the tax base. In the 22% federal bracket, the resulting effective marginal rate reaches roughly 40.7% (22% multiplied by 1.85), a figure derived directly from the 85% inclusion fraction set in 26 U.S.C. 86(a)(2) (Source: 26 U.S.C. 86, Cornell LII, current in force; effective-rate derivation per Reichenstein & Meyer, Journal of Financial Planning, July 2018).
By the numbers
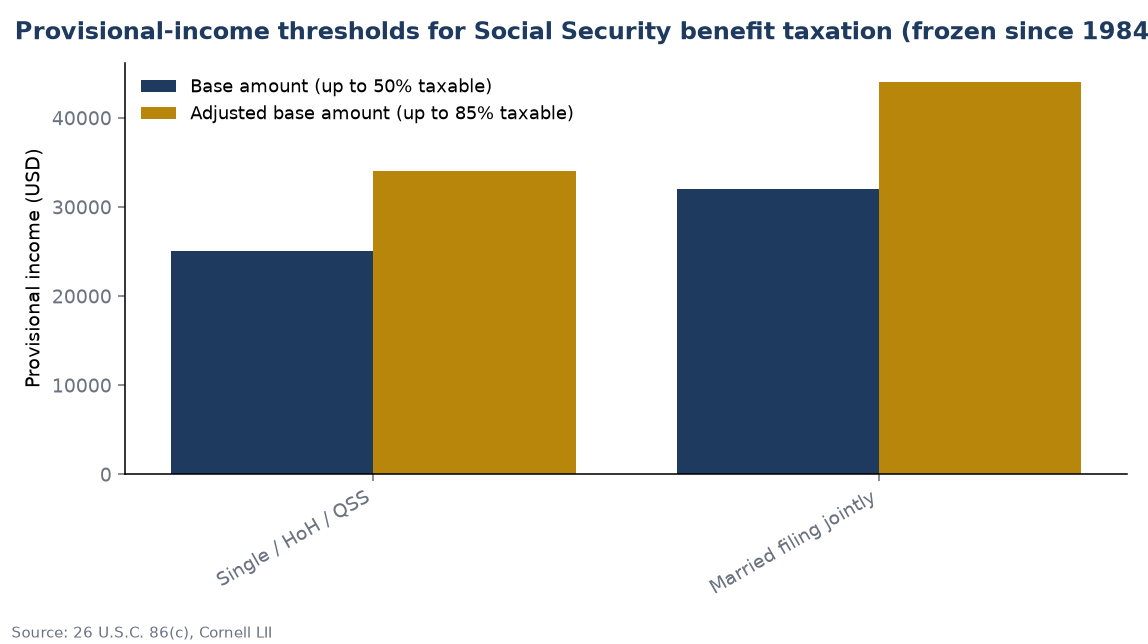
- Single filers face benefit taxation once provisional income exceeds $25,000 (up to 50% taxable) and $34,000 (up to 85% taxable) (Source: 26 U.S.C. 86(c), Cornell LII).
- Married-filing-jointly thresholds are $32,000 and $44,000, unchanged since enactment (Source: 26 U.S.C. 86(c), Cornell LII).
- These thresholds are not indexed for inflation or wage growth (Source: CRS RL32552, everycrsreport.com).
- In 1984, less than 10% of beneficiaries paid federal income tax on their benefits (Source: SSA Issue Paper No. 2015-02, Purcell).
- SSA’s MINT model projects an annual average of about 56% of beneficiary families will owe tax on part of their benefits from 2015 through 2050 (Source: SSA Issue Paper No. 2015-02).
- The taxable share of all benefit payments rose from 12.2% (1994) to 38.2% (2022) (Source: CRS IF11397).
- Federal income tax collected per dollar of benefits rose from 2.2% (1994) to 6.6% (2022) (Source: CRS IF11397).
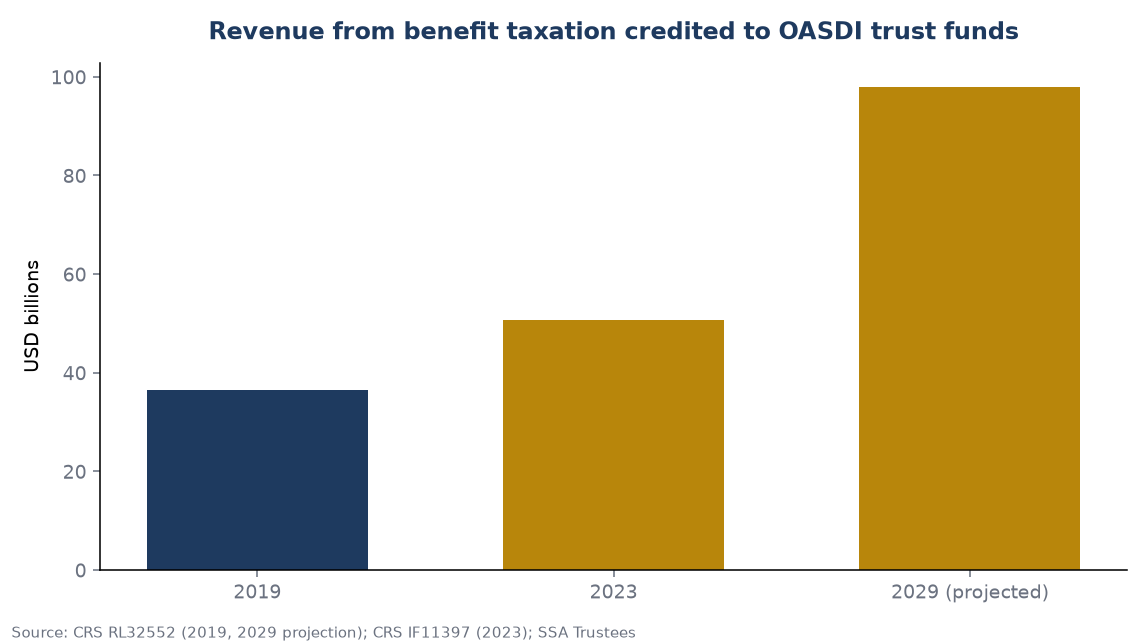
- Revenue from benefit taxation credited to the OASDI trust funds is projected at $98 billion in 2029 (Source: CRS RL32552; SSA Trustees).
The Q3 Advisors index: SS-TMRM
Social Security Torpedo Marginal-Rate Multiplier (SS-TMRM). Tier 1 (50% zone) multiplier = 1.50x; Tier 2 (85% zone) multiplier = 1.85x. Methodology: the effective federal marginal rate on one additional dollar of ordinary income inside the benefit-taxation phase-in equals the statutory bracket rate multiplied by (1 + f), where f is the benefit fraction (0.50 or 0.85) pulled into taxable income under 26 U.S.C. 86(a) and IRS Publication 915 (2025) Worksheet 1.
What the “tax torpedo” is and why it exists
The Social Security tax torpedo is the sharp rise in a retiree’s effective marginal tax rate that occurs while a portion of Social Security benefits is being phased into taxable income. It is not a separate tax. It is a byproduct of how the Internal Revenue Code decides how much of a benefit is taxable, combined with the fact that the dollar thresholds in that formula have never been adjusted for inflation.
Talk With Craig Wear's Team
Craig has helped IRA millionaires save over $1 million each in unnecessary taxes. Find out if a Roth conversion strategy fits your retirement, with no sales pressure and no product pitch.
Benefit taxation began with the Social Security Amendments of 1983 (P.L. 98-21), which made up to 50% of benefits taxable for taxpayers above the base amounts, first effective for tax year 1984. The Omnibus Budget Reconciliation Act of 1993 (OBRA 1993, P.L. 103-66) added a second tier taxing up to 85% of benefits above higher “adjusted base amounts,” effective for tax year 1994 (Source: SSA, History of the Provisions of Old-Age, Survivors, and Disability Insurance, ssa.gov/history; CRS RL32552). The enactment years (1983 and 1993) precede the first effective tax years (1984 and 1994); both matter, because the freeze runs from the year each tier took effect.
The central feature is what Congress chose not to do. As the Congressional Research Service states, “None of the thresholds are indexed for inflation or wage growth” (Source: CRS RL32552, everycrsreport.com). Ordinary inflation therefore drags a rising share of retirees over fixed nominal lines each year. For related context on how benefit taxation is calculated for the current year, see Q3 Advisors’ overview of the taxation of Social Security benefits for 2026.
The statutory mechanics: provisional income and the two tiers
The formula lives in 26 U.S.C. 86. The comparison figure the statute uses is one-half of benefits plus all other income, including tax-exempt interest. In practice this is often called “provisional income” or “combined income.” Modified adjusted gross income under section 86(b)(2) is AGI computed without regard to sections 85(c), 135, 137, 221, 911, 931, and 933, then increased by tax-exempt interest received or accrued (Source: 26 U.S.C. 86(b)(2), Cornell LII). The inclusion of tax-exempt municipal bond interest is a frequently overlooked mechanism: interest that is not itself taxed still counts toward the figure that decides how much of a benefit becomes taxable.
The statute sets two thresholds for each filing status:
| Filing status | Base amount (up to 50% taxable), 26 U.S.C. 86(c)(1) | Adjusted base amount (up to 85% taxable), 26 U.S.C. 86(c)(2) |
|---|---|---|
| Single / head of household / qualifying surviving spouse | $25,000 | $34,000 |
| Married filing jointly | $32,000 | $44,000 |
| Married filing separately (lived with spouse) | $0 | $0 |
The inclusion formula operates in two tiers. Under 26 U.S.C. 86(a)(1), when provisional income exceeds the base amount but not the adjusted base amount, the amount included in gross income is the lesser of (i) one-half of the Social Security benefits received during the year, or (ii) one-half of the excess over the base amount. This is the 50% zone. Under 26 U.S.C. 86(a)(2), when provisional income exceeds the adjusted base amount, the included amount is the lesser of (i) 85% of that excess plus the smaller of the Tier-1 amount or a fixed add-back ($4,500 single / $6,000 joint), or (ii) 85% of the benefits received. This is the 85% zone, and the 85% figure is the statutory cap on how much of any benefit can ever be taxed (Source: 26 U.S.C. 86(a), Cornell LII).
IRS Publication 915 (2025) restates the rule in plain language: “Generally, up to 50% of your benefits will be taxable. However, up to 85% of your benefits can be taxable if either of the following situations applies to you” (Source: IRS Publication 915, 2025 edition). Its Worksheet 1 is the operational engine: it takes one-half of net benefits from Box 5 of the SSA-1099, adds all other income including tax-exempt interest to form the combined-income figure, applies the 50% and 85% fractions to the excesses over each threshold, and caps taxable benefits at 85% of total benefits (Source: IRS Publication 915, 2025; Notice 703, Rev. Nov. 2025).
The marginal-rate math: where the torpedo gets its force
The reason the phase-in creates a marginal-rate spike is arithmetic. Inside a phase-in tier, each additional $1 of ordinary income (an IRA distribution, a required minimum distribution, a pension payment, or the taxable portion of a Roth conversion) does two things at once: it is itself taxable, and it drags an additional fraction of a benefit dollar into taxable income. In the 50% zone, that fraction is $0.50, so $1 of income produces $1.50 of newly taxable income. In the 85% zone, the fraction is $0.85, so $1 produces $1.85 of newly taxable income.
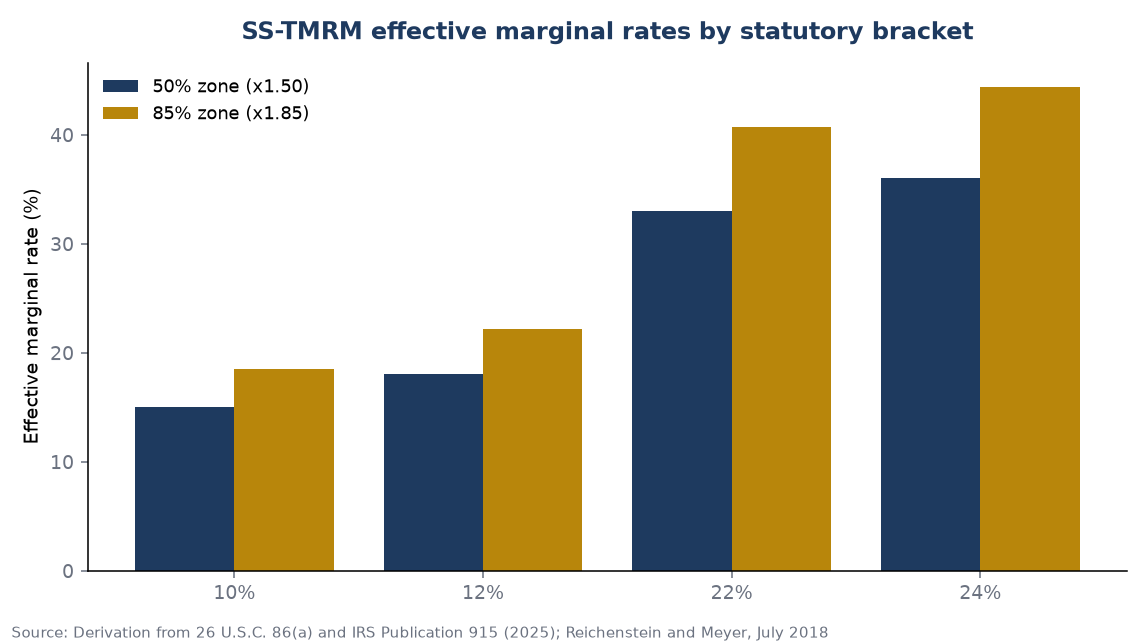
The effective marginal rate is therefore the statutory bracket rate multiplied by the inclusion multiplier. This is the SS-TMRM. The multipliers are 1.50x in the 50% zone and 1.85x in the 85% zone (Source: derivation from 26 U.S.C. 86(a) and IRS Publication 915 Worksheet 1; method set out in Kitces, “The Taxation Of Social Security Benefits As A Marginal Tax Rate Increase,” and Reichenstein & Meyer, Journal of Financial Planning, July 2018).
| Statutory bracket | Tier 1 / 50% zone (x1.50) | Tier 2 / 85% zone (x1.85) |
|---|---|---|
| 10% | 15.0% | 18.5% |
| 12% | 18.0% | 22.2% |
| 22% | 33.0% | 40.7% |
| 24% | 36.0% | 44.4% |
| 15% (legacy) | 22.5% | 27.75% |
| 25% (legacy) | 37.5% | 46.25% |
Worked example: the 22% bracket
Consider a taxpayer in the 22% bracket whose provisional income sits inside the 85% zone. One additional $1 of withdrawal costs $0.22 directly. It also makes $0.85 of a benefit newly taxable, which at 22% costs another $0.187. Total cost: $0.407 per dollar, an effective marginal rate of 40.7% (Source: method per Reichenstein & Meyer 2018; Geisler, Retirement InSight & Trends). Scaled up, a $1,000 withdrawal adds $1,850 to gross income.
Worked example: the 12% bracket
For a taxpayer in the 12% bracket in the 85% zone, a $1,000 IRA withdrawal adds $1,850 to gross income, and tax rises from $120 to $222. That is $222 per $1,000 withdrawn, an effective marginal rate of 22.2% (12% multiplied by 1.85) (Source: Chris Reddick Financial Planning worked example; method per IRS Publication 915).
The legacy peak
Under the pre-2018 bracket schedule, the analysis reached a higher nominal peak. Kitces’ original example used the 25% bracket: 25% multiplied by 1.85 = 46.25%, which he expressed as “$462.50 / $1,000 = 46.25% marginal tax rate” (Source: Kitces). Under the current bracket schedule, the analogous peak within the phase-in for most affected retirees is 22% multiplied by 1.85 = 40.7%; if the 24% bracket is reached inside the phase-in, the figure is 24% multiplied by 1.85 = 44.4%.
An important limitation applies. The multiplier is active only inside a phase-in tier. Once 85% of benefits are already taxed, or when provisional income is below the base amount, the multiplier collapses to 1.00x and the effective rate reverts to the ordinary statutory bracket. The torpedo is a band, not a permanent surcharge.
Which income ranges trigger the torpedo
The torpedo activates as provisional income rises through the two bands. For a single filer, the 50% multiplier (1.50x) applies as provisional income moves through roughly $25,000 to $34,000, and the 85% multiplier (1.85x) applies above $34,000, until 85% of the benefit is fully taxed (Source: Reichenstein & Meyer, Journal of Financial Planning, July 2018; thresholds per 26 U.S.C. 86). The width of the zone in total dollars, and therefore how many marginal dollars incur the elevated rate, depends on the size of the benefit and the filing status.
Practitioner illustrations for specific benefit levels put the steepest part of the torpedo, for the 2022 tax year, at total income roughly above $57,000 for a single filer and roughly above $112,000 for a married couple (about $120,000 for 2023) (Source: Geisler, Retirement InSight & Trends). These dollar figures are year- and benefit-level-specific illustrations, not statutory constants, and they shift with benefit size and the standard deduction each year.
Geisler’s analysis also documents a stacking effect that raises the figure further. For a taxpayer with qualified dividends or long-term capital gains stacked on top, the effective federal marginal rate in his 2022-tax-year example reached 49.95%, versus 40.7% without them (Source: Geisler, Retirement InSight & Trends). The 49.95% figure is a practitioner illustration and was not cross-checked against the Reichenstein & Meyer article; the 40.7% figure and the 1.50x/1.85x multipliers are corroborated across multiple sources.
How frozen thresholds widen the affected population
Because the thresholds are fixed in nominal dollars, the share of retirees exposed to benefit taxation has climbed steadily. In 1984, less than 10% of beneficiaries paid federal income tax on their benefits; Congress designed the 1983 tax to reach only roughly the top decile of retirees (Source: SSA Issue Paper No. 2015-02, Purcell). SSA’s MINT microsimulation projects that an annual average of about 56% of beneficiary families will owe federal income tax on part of their benefit income from 2015 through 2050 (Source: SSA Issue Paper No. 2015-02, restated in CRS RL32552).
The Congressional Budget Office, as cited by CRS, estimated that 49% of Social Security beneficiaries were affected by benefit taxation in tax year 2014, and CRS separately notes that about half of beneficiaries paid income tax on their benefits in 2021 (Source: CBO via CRS RL32552; CRS IF11397). These CBO figures were obtained through CRS restatement rather than a directly fetched CBO document.

The share of benefit dollars actually pulled into the tax base has risen alongside the share of affected families. The taxable share of all Social Security benefit payments was 12.2% in 1994, 33.0% in 2017, and 38.2% in 2022 (Source: CRS IF11397 for 1994 and 2022; CRS RL32552 for 2017). Over the same window, federal income tax collected per dollar of benefits rose from 2.2% in 1994 to 6.6% in 2022 (Source: CRS IF11397).

The median tax bite is also rising. SSA projects that the median percentage of benefit income owed as income tax by beneficiary families will rise from 1% to 5% over 2015 through 2050; among families that owe tax, the median share of benefits owed rises from about 11% in 2015 to 12% in 2025 and remains stable through 2050 (Source: SSA Issue Paper No. 2015-02).

The counterfactual: what indexing would have meant
Secondary compilations citing BLS CPI data suggest that if the $25,000 single lower threshold had been indexed to inflation from 1984, it would sit near $78,000 in 2026 purchasing power, and the $32,000 couples threshold near $100,000 (Source: Yahoo Finance / TheStreet reporting on the “1984 tax trap,” citing BLS CPI). These figures are directionally consistent across sources but depend on the CPI series and end month; a separate search summary cited approximately $80,000 and $110,000. They are presented as illustrative, not exact.
The fiscal footprint of the freeze
The revenue from taxing benefits is credited back to the trust funds, which is one reason the freeze has fiscal momentum. Revenue credited to the OASDI trust funds from benefit taxation was $36.5 billion in 2019 (3.4% of total OASDI income), with Medicare’s Hospital Insurance fund credited $23.8 billion the same year; the figure was $50.7 billion in 2023 (3.8% of total income), and CRS reports a projection of $98 billion in 2029 (6.1% of total income) (Source: CRS RL32552 for 2019 and 2029; CRS IF11397 for 2023; SSA Trustees). The 2029 figure is a Trustees projection, attributed as such.
What sets off the torpedo: RMDs, Roth conversions, and capital gains
Three common retirement income events feed the provisional-income figure. Each lands on the tax return in a way that raises the number that determines benefit taxability (Source: IRS Publication 915, 2025 Worksheet 1).
Required minimum distributions (the involuntary trigger)
RMDs are the income a retiree cannot avoid. Under the SECURE 2.0 Act of 2022, the applicable age for required minimum distributions is 73 for a person who reaches age 72 after December 31, 2022 and age 73 before January 1, 2033, and age 75 for a person who reaches age 74 after December 31, 2032 (commonly described as those born 1960 or later, a derivation rather than statutory text) (Source: IRS RMD FAQs; Federal Register, Required Minimum Distributions final rule, 89 FR, July 19, 2024). The required beginning date is April 1 of the year after reaching the applicable age. Failing to take an RMD carries an excise tax of 25% of the shortfall, reduced to 10% if timely corrected within the two-year window (Source: IRS RMD FAQs). Taxable RMDs flow to Form 1040 line 4b and into provisional income. For the current-year rules, see Q3 Advisors on required minimum distributions for 2026.
Roth conversions (voluntary income now to reduce income later)
A conversion from a traditional IRA to a Roth IRA is not excepted from the rule that traditional-IRA distributions are taxable in the year received; the converted pre-tax amount is includible in gross income on Form 1040 line 4b and therefore raises provisional income in the conversion year (Source: IRS Publication 590-B, 2025). By contrast, Roth IRAs require no lifetime RMDs for the original owner, and qualified Roth distributions are tax-free and do not enter provisional income (Source: IRS Publication 590-B, 2025). That structural difference is why some retirees study conversions as a way to shrink future RMDs. Q3 Advisors describes this work under its Roth conversion service and the concept of the retirement tax window.
Capital gains (they count even at a 0% rate, and they can stack a surtax)
Realized long-term capital gains count fully in provisional income even when they are taxed at the 0% capital-gains rate. For tax years beginning in 2026, the maximum taxable income for the 0% rate is $98,900 for MFJ/QSS and $49,450 for single filers, with the 15% rate ceiling at $613,700 MFJ and $545,500 single before the 20% rate applies (Source: IRS Rev. Proc. 2025-32, sec. 3.03). Large gains can also trigger the Net Investment Income Tax under IRC 1411: an additional 3.8% on the lesser of net investment income or the excess of MAGI over $200,000 (single/HoH), $250,000 (MFJ/QSS), or $125,000 (MFS), effective since January 1, 2013 and not inflation-indexed (Source: 26 U.S.C. 1411; IRS NIIT Q&A). See Q3 Advisors on the Net Investment Income Tax for 2026.
The third surcharge: Medicare IRMAA and the two-year lookback
The same income spikes that fire the torpedo can raise Medicare premiums two years later. For 2026, the first income-related monthly adjustment amount (IRMAA) tier applies when modified adjusted gross income exceeds $109,000 on an individual return or $218,000 on a joint return; IRMAA MAGI is AGI plus tax-exempt interest, taken from the tax return filed two years prior (2024 for 2026) (Source: SSA POMS HI 01101.020, rev. 12/02/2025; POMS HI 01101.010). Because of that lookback, an RMD, Roth conversion, or capital gain realized in one year can raise Part B and Part D premiums two years later. See Q3 Advisors on Medicare IRMAA 2026 brackets and premiums.
The common thread across all three surcharges is design. The provisional-income thresholds ($25,000/$34,000 single; $32,000/$44,000 joint), the NIIT thresholds ($200,000/$250,000/$125,000), and the structure itself are frozen or unindexed, so ordinary inflation plus mandatory RMDs progressively pull more retirees into the zone where the SS-TMRM is active.
Recent law: the senior deduction did not move the thresholds
A 2025 law (P.L. 119-21) created a temporary senior deduction. Per CRS, it does not change the 26 U.S.C. 86 provisional-income thresholds, which remain frozen (Source: CRS R48613, “Taxation of Social Security Benefits and the Senior Deduction in P.L. 119-21”). The specific parameters of that deduction (amount, phaseouts, and any sunset) are outside the scope of this briefing and are not verified here. For related current-year context, see Q3 Advisors on the senior deduction and standard deduction for 2026.
Work with Q3 Advisors
Q3 Advisors is a registered investment adviser focused on retirement tax planning. This article is educational and is not advice; for guidance on your own circumstances, consult a qualified tax or financial professional.
Frequently asked questions
What is the Social Security tax torpedo?
It is the sharp rise in a retiree’s effective marginal tax rate that occurs while a portion of Social Security benefits is being phased into taxable income. It is not a separate tax; it results from the 50%/85% inclusion formula in 26 U.S.C. 86 interacting with ordinary income (Source: 26 U.S.C. 86, Cornell LII).
What is provisional income?
Provisional income (also called combined income) is one-half of Social Security benefits plus all other income, including tax-exempt interest, using modified AGI as defined in 26 U.S.C. 86(b)(2) (Source: 26 U.S.C. 86; IRS Publication 915, 2025).
What are the income thresholds for single filers?
Up to 50% of benefits can be taxable above $25,000 of provisional income, and up to 85% above $34,000, for single, head of household, or qualifying surviving spouse filers (Source: 26 U.S.C. 86(c), Cornell LII).
What are the thresholds for married couples filing jointly?
Up to 50% of benefits can be taxable above $32,000, and up to 85% above $44,000 (Source: 26 U.S.C. 86(c), Cornell LII).
What about married filing separately?
For a taxpayer who is married filing separately and lived with the spouse at any time during the year, the base amount and adjusted base amount are both $0 (Source: 26 U.S.C. 86(c), Cornell LII).
Are the thresholds adjusted for inflation?
No. CRS states, “None of the thresholds are indexed for inflation or wage growth” (Source: CRS RL32552, everycrsreport.com).
When did benefit taxation start?
The 50% tier began under the Social Security Amendments of 1983 (P.L. 98-21), effective tax year 1984. The 85% tier was added by OBRA 1993 (P.L. 103-66), effective tax year 1994 (Source: SSA history pages; CRS RL32552).
What is the maximum share of benefits that can be taxed?
Up to 85% of benefits can be included in taxable income; 85% is the statutory cap (Source: 26 U.S.C. 86(a); IRS Publication 915, 2025).
Why does the effective marginal rate exceed the statutory bracket?
Inside the phase-in, each extra $1 of income also makes $0.50 or $0.85 of a benefit taxable, so the bracket rate applies to $1.50 or $1.85 of income per $1 earned (Source: 26 U.S.C. 86(a); Reichenstein & Meyer, July 2018).
What is the SS-TMRM?
The Social Security Torpedo Marginal-Rate Multiplier is a Q3 Advisors metric: 1.50x in the 50% zone and 1.85x in the 85% zone, applied to the statutory bracket to estimate the effective marginal rate (Source: derivation from 26 U.S.C. 86(a) and IRS Publication 915).
What is the effective rate in the 22% bracket?
Roughly 40.7% inside the 85% zone (22% multiplied by 1.85) (Source: Reichenstein & Meyer 2018; Geisler).
What is the effective rate in the 12% bracket?
About 22.2% inside the 85% zone; a $1,000 withdrawal can raise tax from $120 to $222 (Source: Chris Reddick Financial Planning; method per IRS Publication 915).
Does the higher rate apply to all my income?
No. The multiplier is active only inside a phase-in tier. Below the base amount, or once 85% of benefits are already taxed, the effective rate reverts to the ordinary statutory bracket (Source: 26 U.S.C. 86; SS-TMRM limitations).
Does tax-exempt municipal bond interest matter?
Yes. Tax-exempt interest is added back into modified AGI for this calculation, so it counts toward provisional income even though it is not itself taxed (Source: 26 U.S.C. 86(b)(2)).
How do required minimum distributions interact with the torpedo?
Taxable RMDs flow to Form 1040 line 4b and raise provisional income, which can push more benefits into the tax base. The RMD applicable age is 73 or 75 depending on birth cohort under SECURE 2.0 (Source: IRS RMD FAQs; Federal Register, July 19, 2024).
How do Roth conversions interact with the torpedo?
The converted pre-tax amount is taxable in the conversion year and raises provisional income then, but qualified Roth distributions later are tax-free and do not count in provisional income (Source: IRS Publication 590-B, 2025).
Do capital gains count even if taxed at 0%?
Yes. Realized long-term capital gains count fully in provisional income even when the gain itself is taxed at the 0% rate (Source: IRS Rev. Proc. 2025-32; 26 U.S.C. 86).
What is the Net Investment Income Tax and how does it stack?
NIIT is a 3.8% tax under IRC 1411 on the lesser of net investment income or the excess of MAGI over $200,000 (single), $250,000 (joint), or $125,000 (MFS); a large gain or conversion can trigger it on top of the torpedo (Source: 26 U.S.C. 1411; IRS NIIT Q&A).
How does Medicare IRMAA fit in?
For 2026, IRMAA’s first tier begins above $109,000 (individual) or $218,000 (joint) of MAGI, drawn from the return filed two years earlier, so an income spike today can raise premiums two years later (Source: SSA POMS HI 01101.020).
How many retirees are affected?
SSA projects an annual average of about 56% of beneficiary families will owe tax on part of their benefits from 2015 through 2050; CBO figures cited by CRS put the share at 49% in 2014 and about half in 2021 (Source: SSA Issue Paper No. 2015-02; CBO via CRS).
How much benefit income is now taxed?
The taxable share of all benefit payments rose from 12.2% in 1994 to 38.2% in 2022 (Source: CRS IF11397).
Did the 2025 senior deduction change the thresholds?
No. Per CRS, P.L. 119-21 created a temporary senior deduction but did not amend the 26 U.S.C. 86 provisional-income thresholds (Source: CRS R48613).
Does this analysis include state taxes?
No. The effective marginal rates here are federal only. State treatment varies and is not modeled (Source: SS-TMRM limitations). For state context, see Q3 Advisors on retirement taxes by state for 2026.
Sources
26 U.S.C. 86, Cornell Legal Information Institute, https://www.law.cornell.edu/uscode/text/26/86 (current in force). 26 U.S.C. 1411, Cornell LII, https://www.law.cornell.edu/uscode/text/26/1411. IRS Publication 915 (2025), https://www.irs.gov/publications/p915 and https://www.irs.gov/pub/irs-pdf/p915.pdf; IRS Notice 703 (Rev. Nov. 2025), https://www.irs.gov/pub/irs-pdf/n703.pdf. IRS FAQ, Social Security Income, https://www.irs.gov/faqs/social-security-income. IRS Publication 590-B (2025), https://www.irs.gov/publications/p590b. IRS RMD FAQs, https://www.irs.gov/retirement-plans/retirement-plan-and-ira-required-minimum-distributions-faqs. IRS Rev. Proc. 2025-32, https://www.irs.gov/pub/irs-drop/rp-25-32.pdf. IRS NIIT Q&A, https://www.irs.gov/newsroom/questions-and-answers-on-the-net-investment-income-tax. Federal Register, Required Minimum Distributions final rule, 89 FR (July 19, 2024), https://www.federalregister.gov/documents/2024/07/19/2024-14542/required-minimum-distributions. CRS RL32552, https://www.everycrsreport.com/reports/RL32552.html; CRS IF11397, https://www.everycrsreport.com/reports/IF11397.html; CRS R48613, https://www.everycrsreport.com/files/2025-08-01_R48613_8283dd3f3ebb50f417c3ed64df6a96534514e8e5.pdf. SSA Office of Retirement Policy, Patrick Purcell, Issue Paper No. 2015-02, https://www.ssa.gov/policy/docs/issuepapers/ip2015-02.html; SSA Research, Income Taxes on Social Security Benefits, https://www.ssa.gov/policy/docs/research-summaries/income-taxes-on-benefits.html; SSA history, https://www.ssa.gov/history/taxationofbenefits.html and https://www.ssa.gov/history/1983amend.html. SSA POMS HI 01101.020 and HI 01101.010, https://secure.ssa.gov/poms.nsf/lnx/0601101020. Reichenstein & Meyer, “Understanding the Tax Torpedo and Its Implications for Various Retirees,” Journal of Financial Planning, July 2018. Kitces, “The Taxation Of Social Security Benefits As A Marginal Tax Rate Increase,” https://www.kitces.com/blog/the-taxation-of-social-security-benefits-as-a-marginal-tax-rate-increase/. Greg Geisler, Retirement InSight & Trends, https://retirement-insight.com/how-social-security-benefits-taxation-and-irmaa-raise-marginal-tax-rates-in-retirement/. Chris Reddick Financial Planning, https://www.chrisreddickfp.com/blog/navigating-tax-torpedo-roth-conversions-and-obba. Inflation-adjusted threshold illustrations: Yahoo Finance and TheStreet reporting citing BLS CPI.
About the author
Disclaimer
This material is provided by Q3 Advisors, a registered investment adviser, for informational and educational purposes only. It is not investment, legal, or tax advice, nor a recommendation or solicitation to buy or sell any security or to adopt any strategy. Information is believed to be from reliable sources as of the dates cited, but its accuracy is not guaranteed and figures are subject to change. Past performance does not guarantee future results, and the value of investments can go down as well as up. Registration with the SEC or a state does not imply a certain level of skill or training. See Q3 Advisors’ Form ADV Part 2A for information on services, fees, and conflicts of interest. Readers should consult their own qualified tax, legal, or financial advisor before making any decisions.